What caused South Africa’s death rate to shoot up in the mid-1990s: improved death registration or a new viral cause of death? While there was a seemingly sharp increase in the death rate in South Africa from 1990 to 1999, particularly in the age group 15 to 49, and especially among women, there was strong dissent regarding whether this was due to an increase in the number of deaths registered or due to a sexually transmitted viral epidemic.
In the public domain the contestation was allegedly settled around the turn of the millennium, with a consensus view that HIV had led to a rise in deaths. However, Christopher Rawlins and Rodney Richards respective analyses of the data led them to conclude that the statistical picture did not reflect the emergence of a new cause of death.
For 2021, it was estimated that in South Africa the total number of people living with “HIV” was 8.2 million or 13.7% of the population – 19.5% of adults aged 15–49 years with 25% for women in this age group, and there were an estimated 85,154 deaths, attributed to Aids in 2021, which is 12.2% of all deaths).
StatS SA mid-year population estimates, 2021
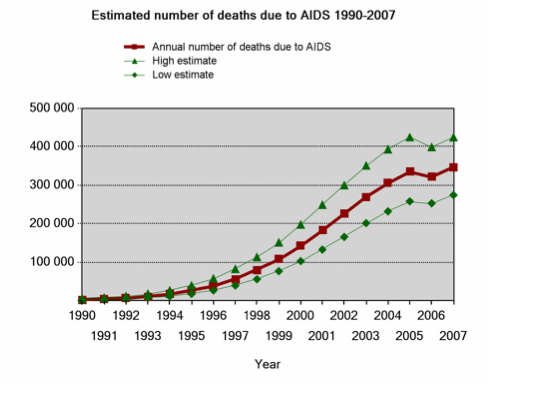
While deaths attributed to HIV/Aids were said to peak in South Africa in 2009, at 43.8% of all mortality, the alleged scourge still continues, albeit tapering down to an estimated 12.2% in 2021, according to the Global Burden of Disease Collaborative Network. This perceived decline is considered due to the uptake of antiretrovirals in the health system. Yet is this portrayal accurate?
Not only is South Africa still held up as an outlier in terms of allegedly having a disproportionate global burden of HIV and Aids, together with some other southern African countries – we are also one of the only countries in Africa to have sufficiently good vital statistics for the estimates churned out by models to be compared to actual data.
Confounding factor: death registration improved in the same years that Aids’ deaths rose
When analysing the data, one has to take into account a major confounding and contingent factor: it was only from the mid-1990s, when the 10 former Bantustans (also known as homelands) were incorporated back into the country, that South Africa’s vital statistics were centralised and began to reflect the entire population accurately (c). Co-incidentally, it was around this time that the so-called “Aids epidemic” was said to have begun ravaging South Africa. With no centralised statistics available for pre-1994. it is thus not possible to compare the death rates of prior decades to those of the Aids era.
With HIV/ Aids said to be escalating in the late 1990s, by the turn of the millennium, shocking predictions of a decimated population, combined with the narrative that HIV is fatal if not treated, framed the debates regarding polices on testing and treatment.
Models created grossly exaggerated projections
These epidemiological projections were based on models, with the most alarmist projections for South Africa coming from models used by UNAIDS and the World Health Organisation (WHO). Nationally, the Actuarial Society of South Africa (ASSA) released successive iterations of their models, which predicted future mortality rates based on prevalence estimates and mortality data from Statistics South Africa (StatsSA), while the South African Medical Research Council (MRC) released reports on mortality and burden of disease in South Africa. The ASSA 600 model was replaced with the 2000 version, and then in 2002, a new model ASSA 2003 was released, with a dramatic reduction in each iteration regarding the estimates for deaths attributed to HIV, journalist and writer Rian Malan reports (Malan 2003).
Rodney Richards (a microbiologist who co-established the corporation Amgen, a manufacturer of HIV tests) writes that by the mid 2000s there was concurrence that the percentage of registered deaths – known as completion of death registration (CDR) – had reached a robust rate of 90% or more of actual deaths, but there were “two radically divergent views about when registration in SA arrived at this point.” The MRC and affiliated researchers asserted a completion rate of 85% was attained by 1996. However, this was in contradiction with the findings of Dr Sulaiman Bah, then CDR specialist at Stats SA, who estimated that the CDR rate in rural areas was a meagre 37% in 1996 (Stats SA. 2000 cited by Richards 2005), with the Census of that year showing that although 46% of the population inhabited rural areas, only 24% of deaths were registered there. The reason CDR had improved so dramatically in the late 1990s was due to the implementation of wide-ranging government strategies to make the registration of deaths easier, especially in rural areas. Richards documents how this was successful in generating a substantial increase in the rate of reported deaths from around 1996 to 1998. And in the expert opinion of senior statistician Dr Bah, a large percentage of the increase in mortality from the mid-1990s was the result of improvement in CDR.
Bah wanted this issue to be fully resolved prior to research being published (Malan 2007). However, the MRC epidemiological data was prematurely featured in an alarmist report 9 July, 2000 in the Sunday Times entitled, “Young, Gifted and DEAD – HORRIBLE TRUTH: In SA young people are dying before their parents”, in which it was stated that the reported two-fold increase in deaths was directly attributable to Aids.
Terrifying predictions fuelled fear
Then, in October of 2000, in a Reuters report in The Independent, “Aids bomb ticks, half of SA adults at risk”, local actuarial expert, University of Cape Town Emeritus Professor Rob Dorrington, who was instrumental in the creation of the ASSA models and has been lead and co-author of MRC papers on mortality and the burden of disease, was quoted as predicting that by 2010 close on 50% of adults could be infected, with life expectancy dropping from 63 to 41, unless strong action was taken. It was also reported that the MRC would initiate clinical trials of a vaccine against HIV the following year, projecting that it would be available within four years. More than two decades on – no vaccine has been created.
The 2001 MRC report estimates that the CDR in 1993 was 57%, increasing to 89% by 1999/2000. Thus the percentage of deaths due to Aids was estimated to have risen from 9% in 1995 to 40% by 2000 (Dorrington et al. 2001). In an article in Rolling Stone in November 2001, Malan noted however that Stats SA disputed the MRC’s conclusion; the Washington Post reported that the census bureau had “called the MRC study ‘badly flawed,’ saying ‘the samples were not representative, and assumptions about the probability of the transmission of the virus that causes Aids were not necessarily accurate’ (Rian Malan, Rolling Stone, 2001).
Behind the scenes, dispute over CDR continued
Richards asked the crucial question: “are we seeing more HIV-related deaths, as claimed by the MRC, or more complete recording of deaths, as a result of the aforementioned government reforms?”
Thus, Richards asked the crucial question: “are we seeing more HIV-related deaths, as claimed by the MRC, or more complete recording of deaths, as a result of the aforementioned government reforms?”
If Dr Bah’s assessment that within the context of overall CDR of around 63%, in his estimation, a 37% CDR in rural areas in 1996 had reached a high of an overall 90% at the turn of the millennium is accurate, this means that raw death registration data would appear to show that deaths in rural areas had risen by 143%, even in the absence of any real increase in mortality. Given that the 1996 Census indicated nearly half of the population (46%) lived in rural areas, the significance of this possibility cannot be understated, Richards explains (2005).
Dorrington and colleagues’ 2001 paper asserts that only a small fraction of the surge in mortality rate could be “accounted for by improved death registration”, referencing a paper, cited as, Mortality trends 1985-2000: From Apartheid to Aids, by I M Timæus, Dorrington, that would document the calculations to underpin this claim, which was described as in the process of being published. However, by 2005, Richards notes, this report has not yet been published (Richards 2005)and he commented that at that time, “no one has yet provided a reference to any study that details any methodology or data used to arrive at this conclusion.” I wrote to Prof Dorrington asking about this paper but did not get a response.
Does this or any other report exist that explains how the MRC calculated the CDR figure of 85% for 1996 when Stats SA estimated 63%? Particularly since, as Richards reminds us, the government had implemented extensive strategies to increase the CDR, especially in rural areas, in the years following 1996, which would be expected to generate a substantial increase in the rate of reported deaths.
In early 2005, Stats SA released a report, Mortality and causes of death in South Africa, 1997-2003. This included an analysis of a colossal backlog of 3.3 million death notifications, leading to the key conclusion that between 1997 and 2002 there was an overall rise in reported deaths of 57%, with the highest growth of 105% in adults between the ages of 15 and 49. Thus, between 1997 and 2001 the number of registered deaths had risen by a massive 134%. Yet Stats SA did not mention the contentious issue of the extent to which CDR could account for this increase.
Then, in May 2006, Stats SA published a mortality report stating that the increase in CDR had increased from about 68% in 1998 to just under 90% in 2003, which, Malan points out, is in contradiction of the earlier Stats SA report and provides support for Dr Bah’s assessment and Richards’ analysis (Malan 2007).
This is not science. It is a pathetic exercise that serves no other purpose than to covertly transform SA registered deaths into totals that agree with UNAIDS’ latest computer model.
Rodney Richards (Malan 2007)
However, Malan documents that one of the UNAIDS responses to the “credibility crisis” generated over the inflated estimates of death due to HIV, was to send over a US scientist, Barbara Anderson, for a collaborative research project between UNAIDS and Stats SA, which then re-analysed the mortality data between 1997 and 2004. They came out with their report in September 2006, which is in contradiction of the Stats SA May report, noting a decrease in completion of death registration from 1998 onwards for both male and female, despite the intensive government efforts to increase registration. The effect was to concoct an increase in overall mortality from 14% to 45% and from 30% to 83% for sexually active adults, between 1998 and 2004, Malan writes (Anderson and Phillips. 2006 cited by Malan 2007).
Meanwhile, successive computer-generated models downsized the scale of the epidemic.
Richards notes that the ASSA 600 model had inflated the projected mortality rate due to Aids in sexually active women for 2001 (the year it was released) by 60% and forecast that, without treatment, by 2010 the number could reach seven million (Richards 2005).
[HIV prevalence for ASSA 600 was calculated utilising antenatal care (ANC) surveys up to 1997. A 25% probability of mother to child transmission at birth and then a probability of 10% after birth were assumed. A further assumption was that HIV-infected babies died at an annual rate of 30% whilst a median survival time of 10 years from infection to death was reckoned for adults (Dorrington et al. 2001:19-20).]
The ASSA 2002 model, issued in June 2004, predicted a mortality rate for sexually active women of 153 000 for 2005, which was halved from the estimate in 2001 (Richards 2005).
[According to ASSA 2002, life expectancy was expected to drop from 54 to 41 in 2010, the total number of deaths was projected to increase in 2001 from 587 300 in 2001 to 1 185 200 in 2010, with deaths caused by HIV to increase from 194 900 (33.2%) to 779 100 (65.7%). ]

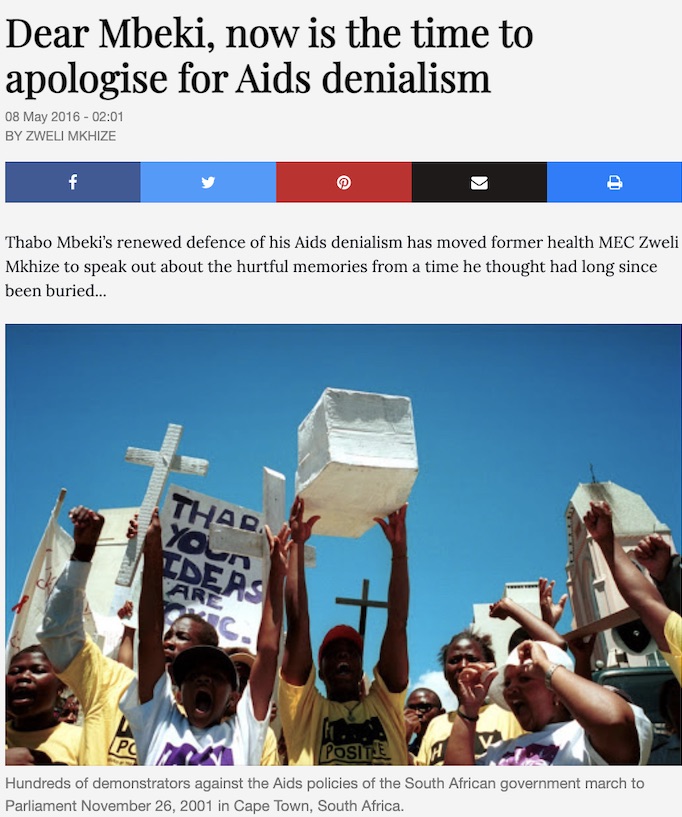
Yet it was these devastating predictions that fuelled the narrative that South Africa was in the grip of a deadly epidemic of plague-like proportions, which formed the context for social movements, civil society, trade unions, academia and the media to strongly oppose the government’s cautionary approach and to force the government’s hand, through legal action, to provide toxic drugs to those who tested positive, and to pregnant women and their babies.
According to a 2006 joint report by the MRC and ASSA, headed by Dorrington, it was estimated that the incidence of HIV had peaked in 1998 and that the epidemic of HIV infection had begun to stabilise at six million, as the number of new infections began to decelerate to the point of corresponding with the number of people dying of Aids. “During this period, the number of people dying from Aids each year is increasing rapidly and is expect [sic] to plateau after 2015” (Dorrington et al. 2006:3). Then the successive model, ASSA 2008, further reduced the annual number of Aids deaths from 257 000 in 2005 to 194 000 in 2010.
There is always some degree of uncertainty about predicting the future. Data on the epidemic in South Africa are scarce so we need to use the imperfect information that we have to forecast the future
Dorrington (Fassin 2007: 234-7)
Anthropologist Didier Fassin points out that the ASSA projections published in 2000 became “the main reference for the entire community in the years following.” He also notes that in 2003, the models were revised and it was also noted that the most affected by the epidemic were black South Africans, while there were not even figures calculated for whites, so negligible was the impact on this race group. In 2004, life expectancy has risen to above 50 years, from an earlier estimate of a low of 40.
HIV prevalence and mortality rates do not equate to a viral epidemic
Richards also analysed Stats SA’s province by province data for 1997 to 2002, which was not included in prior studies. Higher mortality would be expected to occur in the provinces with the higher HIV prevalence rates. However, Richards found that provincial mortality rates and prevalence rates did not correlate well. Instead, he found a greater increase in mortality rates in the more rural provinces, which is where you would expect the improvements in death registrations to be greater, since it was in the more rural provinces that death registration had been the lowest. Richards writes that the “proportion of a province that was living in rural areas in 1996 can explain 78% of relatively higher increases in reported mortality from 1997 to 2002” (Richards 2005).
Richards further calculates that if one looks at the estimated increase of death registration in the more rural provinces and compares this with the increasing mortality rate (taking into account the population growth), one finds that about 78% of the recorded 96% increase in deaths in women between 1997 and 2001 can be accounted for by the dramatic improvement in registration of deaths. This would then mean an actual increase in deaths of 21% over the four years or a yearly increase of an average of 4.9%. The 1996 Census demonstrated that there was still a preponderance of women in rural areas, continuing from the apartheid years when black women were more restricted to rural areas and Bantustans than migratory male workers. In 1996, Limpopo Province had 34% more women than men, the Eastern Cape 30% more and KwaZulu-Natal 21%. Predictably then, there would be more female deaths than male in these regions.
Chris Rawlins, who trained in statistical analysis and is the General Secretary of the Treatment Information Group (TIG) (which is headed by Anthony Brink, also featured in Between the Bands – BtB), analysed the data, which he discusses in BtB, and came to the same conclusion as Richards that the increase in death over this period was in line with what would be expected, based on Dr Bah’s CDR estimates and population growth, and also taking into account the influx of an estimated three million Zimbabweans into South Africa, many of whom were undocumented, following the economic collapse in their country.
Did SA really experience a catastrophic epidemic of murder and suicide between 1997 and 2001, or are these illusions generated by revolutionary improvements in death reporting?
Rodney Richards (2005)
During the period of 1997 to 2001, deaths from tuberculosis (TB) increased by a staggering 134%, which is also held up as proof that Aids was decimating the population, since TB had been deemed an Aids opportunistic infection. However, what was not mentioned was that deaths from other causes had also escalated; deaths due to assault rose by 187% and deaths due to gunshot by 250% in the same period, for example. Richards surmises that the reason Stats SA did not scrutinise the influence of the sizeable increase in completeness of death records on mortality rates attributed to HIV is that it was “politically impossible”.
“As soon as it became apparent that Stats SA might reach a conclusion that embarrassed or challenged the Aids lobby, the agency and its head became the object of a campaign of vilification that inspired sectors of the media to dismiss the COD [cause of death] report as ‘unhelpful’ or ‘flawed’ before its findings were even known. It also seems to have intimidated Stats SA to such an extent that the final report refrained from making any pronouncement regarding the critical CDR issue. Every graph in the report contained a caveat noting that CDR had improved during the period under review, but there was no attempt at quantification,” comments Richards (2005).
Rawlins’ finds HIV prevalence and mortality data mathematically irreconcilable
Another issue is that the population-based surveys from which HIV prevalence is estimated cannot be balanced with the mortality data. In June 2009, the third of three population-based HIV prevalence surveys, for the year 2008 (the previous were for 2002 and 2005), was published by the Human Sciences Research Council (HSRC) in collaboration with the MRC, the National Institute of Communicable Diseases (NICD) and an NGO, CADRE (Shisana et al. 2009)
Rawlins compared these successive three HRSC surveys to the ASSA models. He found that the changes in prevalence for the various age groups in the period between the surveys, and the surveys’ prevalence data in comparison to the ASSA models “cannot be reconciled” and that “[t]here is an increasingly large divergence in the prevalence rates between different race groups.” He found “no correlation between the HIV measurement and mortality among children and the assumptions made by the HSRC.” In addition, Rawlins finds an overestimation of HIV prevalence in all age groups when evaluated against the mortality data.
HIV tests have “no reliability as a constant measurement over time as there is no mathematical relationship between incidence, prevalence and mortality” in the data produced by these organisations.
Chris Rawlins (2009)
Rawlins explains in BtB that there are not only “irreconcilable differences” between the HSRC surveys but also between the HSRC surveys and the ASSA models. His papers can be found on the Treatment Information Group website. The first paper is: A critical analysis of child HIV prevalence as presented in the South African national HIV prevalence survey of 2008. Then he published: A critical analysis of the underlying assumptions used by Chigwedere et al in their article “Estimating The Lost Benefits of Antiretroviral Drug Use in South Africa,” in JAIDS in December 2008. He followed this with another paper in 2015: An analysis of the relationship between the hiv measurement and mortality in South Africa from 1996 to 2012 based on the official research statistics.
In December of that year, he had a letter published in The Mercury, which drew attention to the fact that the statistical data did not provide evidence that a new cause of death was decimating the population or that the decline in the mortality rate could be attributed to the antiretroviral programme. Then, in 2016, Rawlins published a tabular summary of his three previous analyses, The relationship between the hiv statistics and child mortality in South Africa-1996 to 2012: Summary Version of Previous Analyses. He followed this up with a one page summary, The irreconcilable contradictions between the HSRC’s hiv statistics and StatsSA’s mortality data.
“To make my conclusion easily understood my final single page analysis demonstrates the irreconcilable contradiction between the HSRC’s hiv statistics and StatsSA mortality data, put simply there is no relationship between the hiv measurement and actual registered mortality. This is what the many dissenting scientists have argued for years, that an invalid, non-specific diagnostic test has been used to create the illusion of a pandemic, in the process stigmatising millions of mostly poor people and compelling them to ingest drugs which have proven serious adverse effects. Kevin de Cock, the director of the WHO aids program, acknowledged the falsity of the hypothesis and the failure of all the model predictions on 8 June 2008 when he declared that there never was and never will be a heterosexual aids epidemic. Literally billions of dollars have been diverted to an industry led by the pharmaceutical companies at the expense of the real underlying causes of disease, poverty, malnutrition, dirty water, lack of hygiene, decent housing and employment. Luc Montagnier, the French scientist awarded the Nobel prize for discovering the alleged virus, is on record in the 2009 film House of Numbers, saying that with good nutrition the virus can be completely eliminated in weeks,” comments Christopher Rawlins.
When looking at the Stats SA 2017 mortality report, he comments that “[t]he falsity becomes even starker,” since there was “a 5% decrease in total deaths to 446,000, at a time when the total prevalence was allegedly 7.4 million, the HSRC reported 6.4 million in 2012, of which 4.2 million were allegedly on the drug treatment, but in an address in July 2016 activist Mark Heywood acknowledged that less than 50% of those starting the drugs were still receiving five years later. Millions had never started or had abandoned the drugs yet the mortality continued to decline.”
Lack of causality between mortality in children and use of antiretroviral therapy
“More than 330,000 lives or approximately 2.2 million person-years were lost because a feasible and timely ARV treatment program was not implemented in South Africa. Thirty-five thousand babies were born with HIV, resulting in 1.6 million person-years lost by not implementing a mother-to-child transmission prophylaxis program using nevirapine. The total lost benefits of ARVs are at least 3.8 million person-years for the period 2000-2005.”
Chigwedere et al, Estimating the Lost Benefits of Antiretroviral Drug Use in South Africa, JAIDS, 2008
Rawlins research and his summary, however, shows that neither these estimates nor the HSRC’s 2008 prevalence survey or ASSA’s 2008 model, which used the South African Department of Health’s antenatal statistics, are verifiable. Rawlins is quoted on the TIG homepage, as concluding that no “causal relationships exist between the measurement labelled hiv and the increase in child mortality in South Africa up to 2006, and the use of drugs labelled antiretroviral and the decrease in child mortality after 2006. Utilising further data from the latest HSRC survey of 2012; the Medical Research Council study of under-5 mortality statistics of April 2012; and Statistics South Africa’s annual mortality and causes of death reports up to 2012, the summary categorically demonstrates that there is no causal relationship between the measurement labelled hiv, the drugs labelled antiretroviral, and child mortality in South Africa.”
I requested interviews with Professor Dorrington and another lead researcher, Professor Debbie Bradshaw but was unsuccessful. I also contacted then ASSA head, Peter Doyle, who referred me to Nathea Nicolay. She agreed to an interview. I sent questions to which she replied suggested alternative questions. I responded that I still wanted to ask the original questions and then she stopped replying.


In summary:
- Dr Bah calculated that improved CDR was a key factor in the increase in mortality in South Africa, from the late 1990s into the 2000s.
- Richards’ analysis shows that HIV prevalence does not correlate with the increase in mortality rate but that improvement in CDR does, based on provincial data released in the early 2000s.
- Rawlins demonstrates the impossibility of trying to reconcile the mortality rates with estimated changes in HIV prevalence in various age groups, as cohorts move through time, and points to the contradictions between the HSRC surveys and the ASSA models. Rawlins also points to the lack of analysis regarding HIV’s clear discrimination by race.
Rawlins, Richards, Malan and I have unsuccessfully tried to engage the MRC regarding the inconsistencies surrounding Aids epidemiology and neither Richards nor Rawlins’ papers have elicited any response or repudiation.
Reappraisal of the theory that HIV causes AIDS long overdue
Already in 1999, Perth Group member Dr Valendar Turner observed that considering the epidemiological data had been shown to be “inconsistent with the predictions” of HIV theory, this should lead to an “obligatory” reappraisal (Turner 1999). This is reiterated by Rawlins in BtB, where he states that in other “scientific endeavours” when predictions do not manifest, this would generally lead to a reappraisal of the scientific theory underpinning them.
Next post in Aids epidemiology: Why has the virus only led to a “heterosexual epidemic” in southern Africa? How can a virus be so selective? How can the heterosexual epidemic largely be confined to a few southern African countries? Click here to find out more.